This article describes how to work in XMapTools with data that have been calibrated by an other program.
The calibrated maps should be translated first into a compatible format (e.g. txt or csv file). Use the element or oxide abbreviation as file name (e.g. Si.txt, SiO2.txt, Ce.txt, etc.).
Table of Contents
Importing calibrated maps
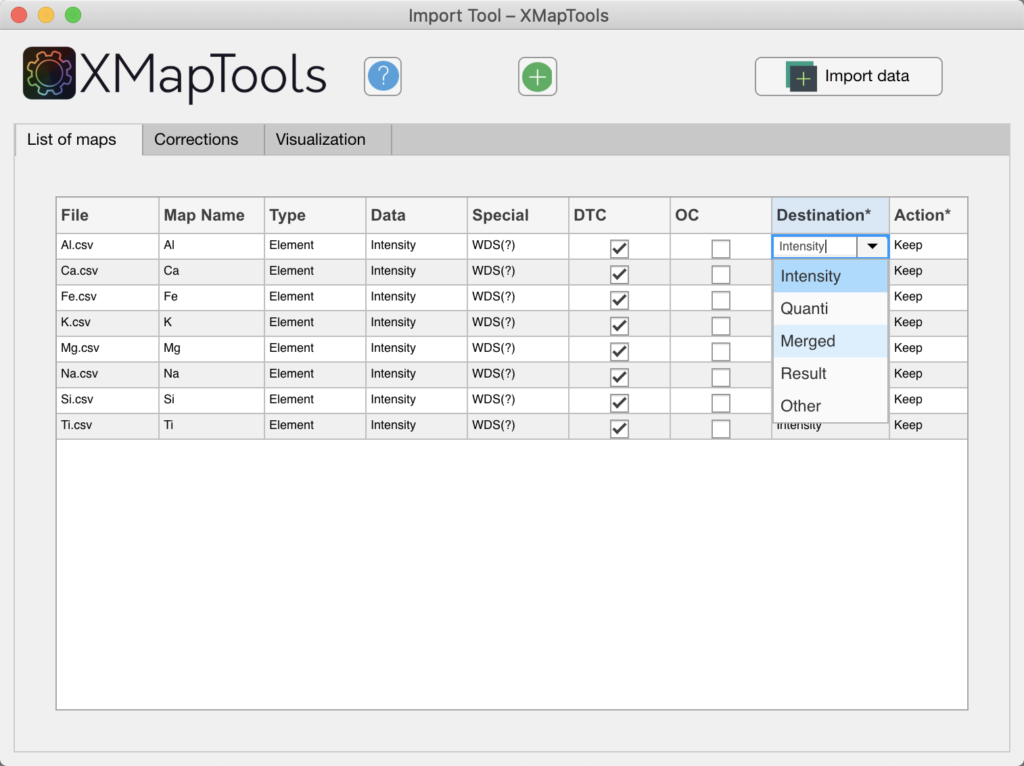
Quantitative maps can be imported in XMapTools via the Import Tool. Quantitative maps can be expressed in µg/g or wt% of elements (e.g. Si.txt, Al.txt, etc.) or oxides (e.g. SiO2.txt, Al2O3.txt, etc.). These maps are imported in the category “Merged” data. The data format is not specified during the import.
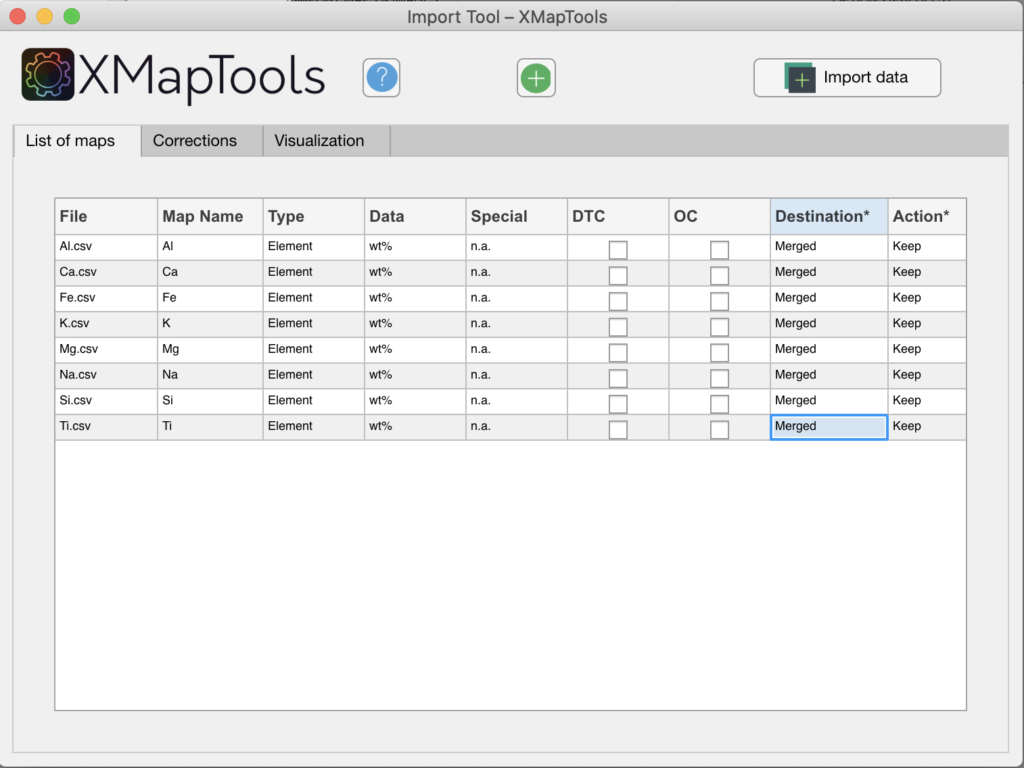
- For maps expressed in µg/g or wt% of oxides, the destination is automatically set to “Merged”. No action is required, simply press the button Import Data.
- Maps expressed in µg/g or wt% of elements, the destination must be changed manually to “Merged” (see figure below). This operation needs to be repeated for each map. The click on the button Import Data.
Converting (optional)
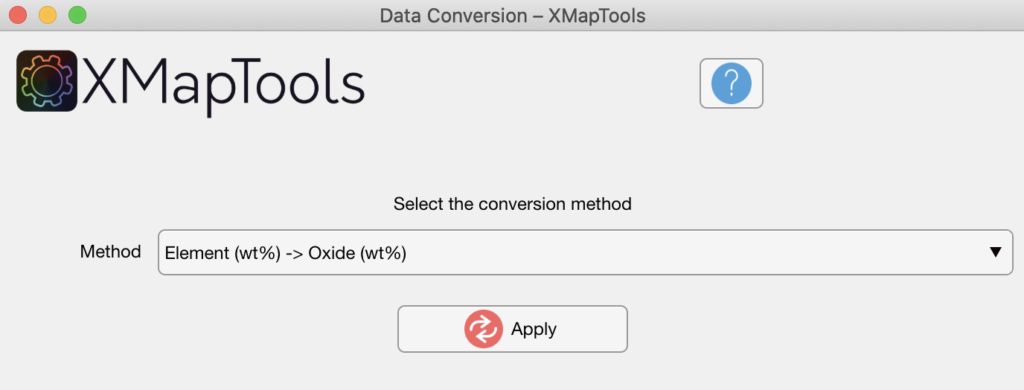
The compositional maps should ideally be expressed in oxide wt%. if the imported maps are in µg/g or wt% of elements, a conversion step can be required to calculate structural formulas.
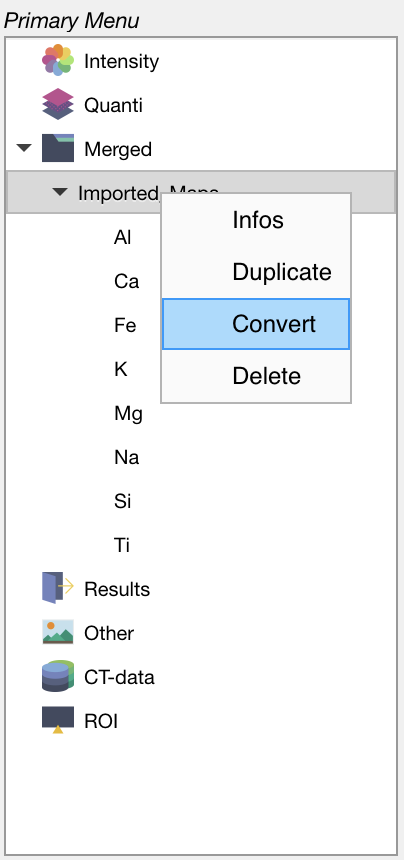
In the primary menu, select the dataset “Imported_Maps” and then right-click on its name. Select the option “Convert” to open the Converter module.
Select the conversion method in the Converter tool and press the button Apply.
Classification from quantitative data
Create a training set
Display a map from the dataset using the Primary Menu and open the tab Classify. Select Training Set (Classification) in the Secondary Menu and press the button Add in Classify. Press again the button Add to create a new mask definition in the training set. This operation can be repeated until the correct number of phases is reached. Each mask definition can be deleted by right-clicking on the name and selecting Delete.
You can rename each mask definition by double-clicking on his name in the Secondary Menu. Press Add in Classify when a mask definition is selected to add a region-of-interest (ROI).
A more detailed description of the procedure is available here.
Add maps for classification
Select the dataset in the category Merged of the Primary Menu and press the button “Add Maps for Classification” to add all the maps of the dataset in the list that will be used by the classification function.
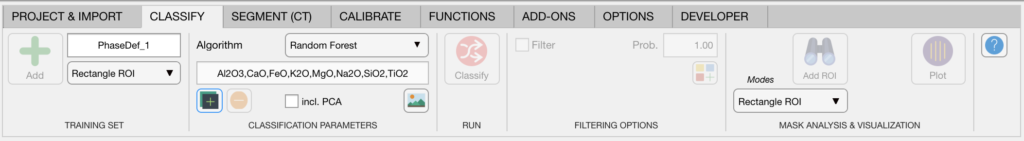
Classification
Select a dataset in the category Merged of the Primary Menu and a Training Set in the Secondary Menu. Pick an algorithm in the tab Classify and press the button Classify. Note that the button Classify is only available when the appropriate items are selected in the primary and secondary menus (i.e. a dataset and a training set).
Splitting a merged dataset
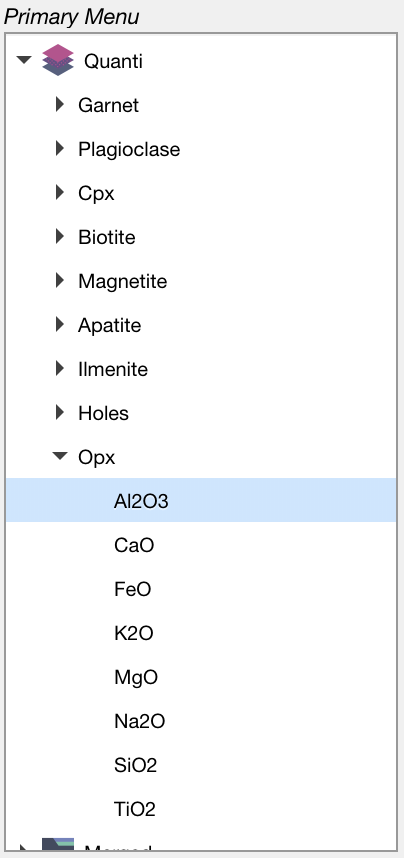
The imported dataset available in the category “Merged” has to be divided into maps for each mask that will be stored under the category “Quanti”.
Select a mask file in the Secondary Menu. Then, select the dataset in “Merged” and then right-click on its name. Select the option “Split (using maskfile)”.
The results are stored under the category “Quanti” as individual dataset, one for each mask.
These data sets can be used to calculate maps of structural formulas or other calculations.
Was this helpful?
9 / 0